Retail
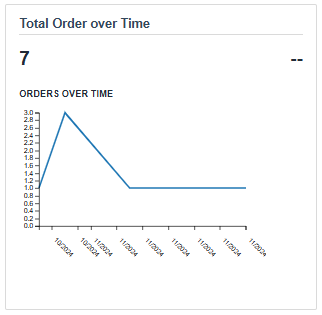
- Total Order Over Time: Displays the total number of orders that have occurred during the selected date range
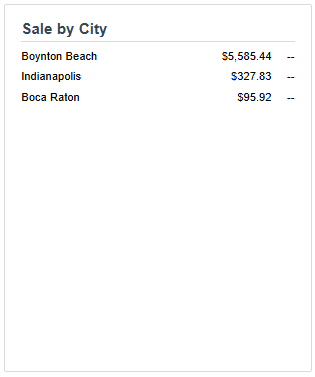
- Sale by City: Displays the total amount of sales by the associated city within the selected time range
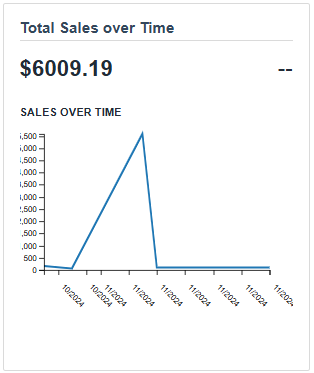
- Total Sales Over Time: Displays the total number of sales that have occurred during the selected date range
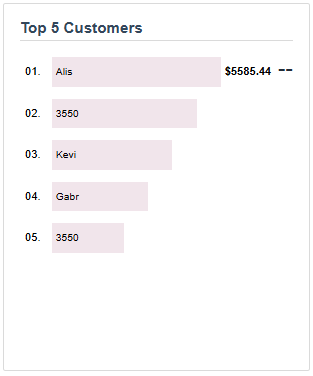
- Top 5 Customers: Displays the top 5 customers based on the number of sales made during the selected time range. You can also hover over each graph bar to see a full name description
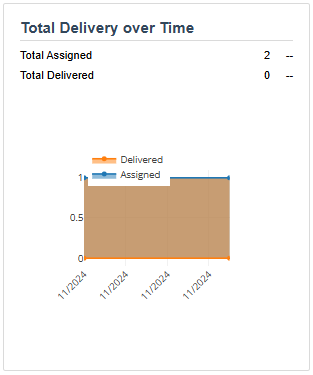
- Total Delivery Over Time: Displays the number of deliveries that have taken place during the selected date range. This graph can be expanded or adjusted as needed by hovering over the graph to reveal the toolbar within the panel
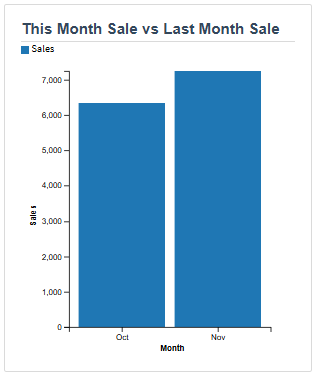
- This Month Sale vs Last month Sale: Displays the difference between the total sales of the previous and current month
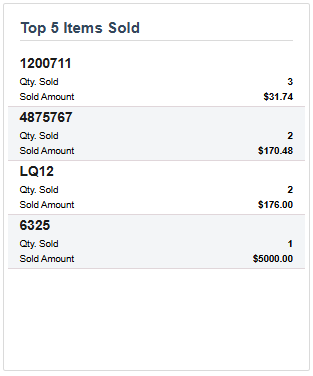
- Top 5 Items Sold: Displays the item number, quantity, and total sales amount of the top 5 items sold during the selected time range